

Sure, your website helps you sell, but did you know it can also help you measure your marketing performance?
Your website is a treasure trove of data. With data mined from your own site, you can track key performance indicators (KPIs) to gauge your marketing success.
Google Analytics is the key to this measurement (although at AutoSweet, we also track such metrics for our clients via our dashboard, accessible 24/7).
Let’s look at a few examples of metrics you should be tracking as indicators of your marketing success, and why they matter.
#1: Traffic Sources
It’s essential to know how customers are arriving at your website. The “acquisition overview” in Google Analytics has great metrics that show how customers are finding you.
They could reach your site from an advertisement, an email, organic search, social media, or from another website that has linked to yours (called a “referral” on GA).
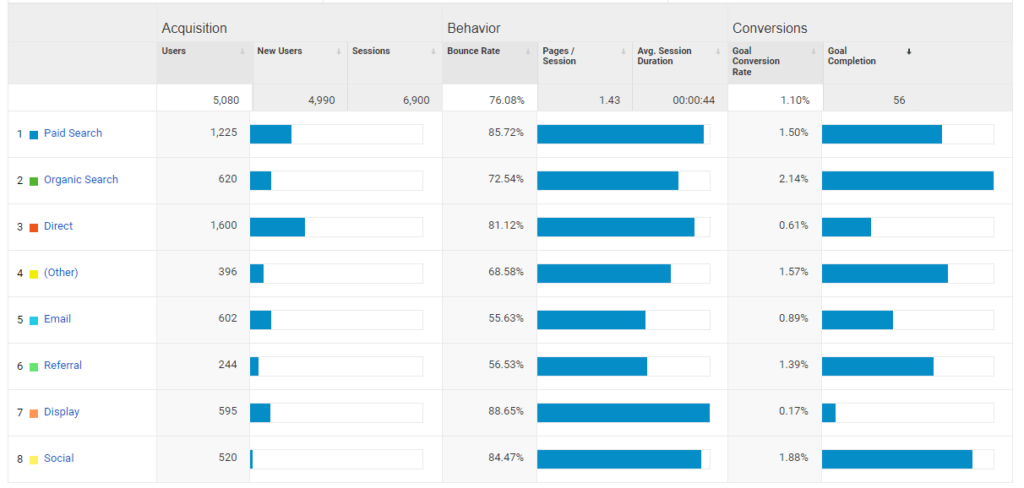
If you set up goal conversions, such as tracking whenever a form is filled out on your website, you can even track which traffic sources bring you the most leads and have the highest conversion rate.
Dig Deeper Into Where Your Traffic Sources Come From
By default, the acquisition section displays your, channel sources to show you the main marketing channels that are producing traffic for your website.
But, Source/Medium, also in the acquisition section, will be able to give you even more specific details about traffic sources, like how many visitors came from your email campaigns, ad campaigns, etc.
Finally, make sure you understand what devices are being used to browse your website by navigating to Audience > Mobile > Overview. This section of Google Analytics will give you a sense of what portion of your audience is viewing your site on a desktop computer, mobile device, or tablet.
#2: Visitor Engagement
You can see how engaged people are in your website by checking a variety of metrics in Google Analytics that measures how users interact with your site. The majority of these metrics are listed under the Audience section of GA.
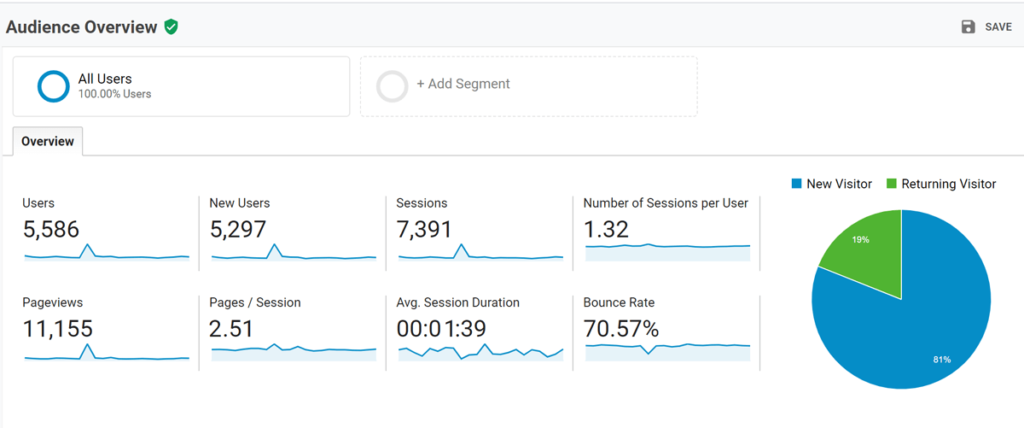
Here are some key website metrics to take note of:
- Session time is a measure of how long a visitor is on your site. Some studies say people spend 9 hours online shopping for cars before they purchase, so the longer they’re on your site, the better.
- Time on page tracks how long a visitor stays on a particular page or a URL.
- Bounce rates track the percentage of single-page sessions in which there was no interaction with the page. A bounced session has a duration of 0 seconds
- Pages / Session will tell you the average number of pages users visit each time they visit your website.
Dealers should also note what pages are most popular with these metrics. This data is mostly contained in the Behavior section of Google Analytics.
Are people viewing your inventory? Your blog? Your specials or service pages?
All this information shows how people engage with your content or inventory, and for how long. Session times of 2-3 minutes are a good baseline and are also helpful to watch month over month.
#3: Returning Visitors
Google Analytics also tracks new versus returning visitors. A new visitor is someone who hits your website on a new device, and a returning visitor, of course, is someone who comes back to your site on the same device.
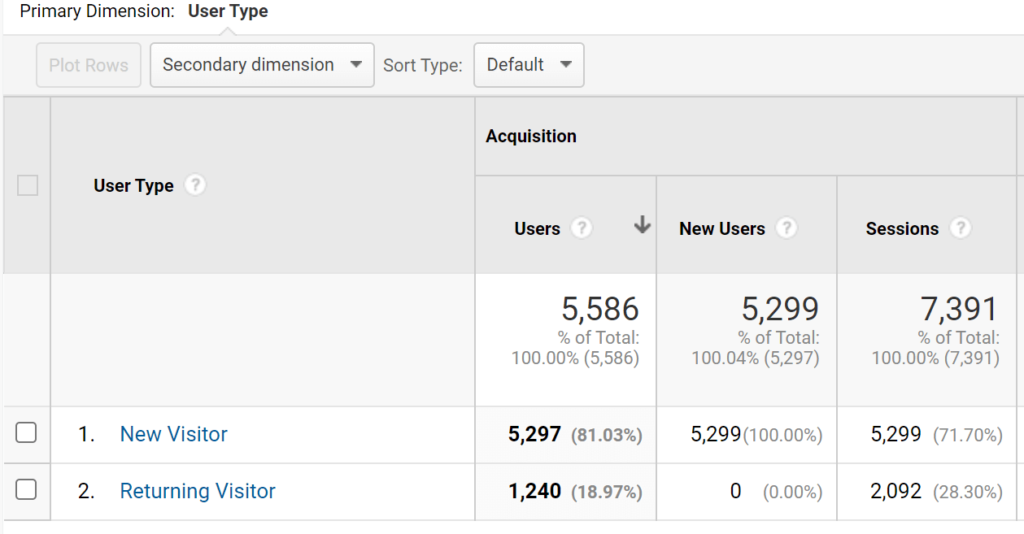
In Google Analytics (Audience>Behavior>New vs.Returning) you can dig into the data on sessions to track marketing performance. After a big digital marketing campaign, you should see your new visitors tick up month over month.
#4: Geographic Location
Do you know where your website visitors live?
Take a look at the location of your users in Google Analytics by clicking User > Demographics > Demographic Details.
You’ll see a reporting page of all the countries and cities your website visitors reside in. Click the cities tile and you’ll get a list of the location of your visitors, like this one:
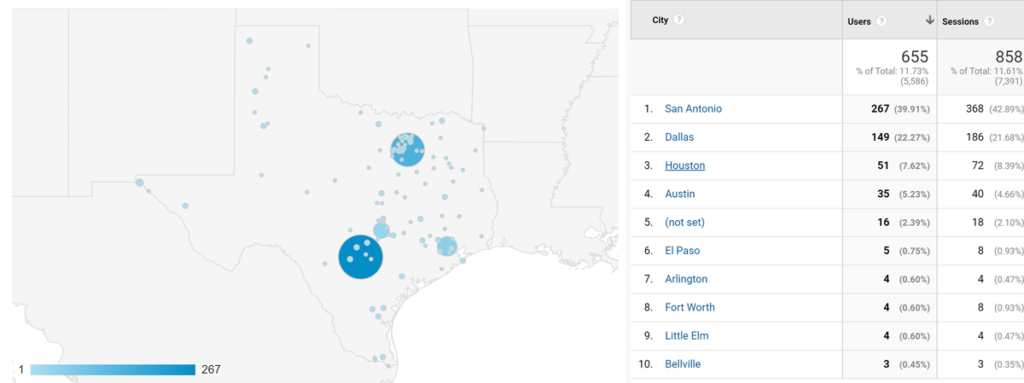
Do any of the locations surprise you? If there are some areas where you’re not currently advertising, you could use this information to run some targeted ads on Facebook and Instagram using these zip codes to reach an audience you hadn’t before.
Why Should You Pay Attention to Your Website Metrics?
Watching your website’s metrics regularly helps you measure the success of your marketing campaigns, and also lets you gauge the overall health and growth of your business. Use your insights to drive sales and inform your future marketing efforts. Or better yet, let the experts at AutoSweet help you!
Not only do we build beautifully designed, fully responsive dealership websites, we also provide reporting updated daily, accessible around the clock via our 24/7 transparent dashboard. We have the insights and expertise to understand how web metrics are driving your performance, demonstrating how your marketing dollars are driving sales.
Ready to see how AutoSweet can help get more traffic to your website and generate more leads that result in sales?
Reach out to us today to schedule a 5-minute demo!